
Methodology
Context
Data dump
More charts
Conclusion
Grow organic visibility across search engines and AI discovery platforms.
Drive qualified traffic, leads, and revenue with AI-driven paid media strategies.
Build high‑performing websites and conversion experiences that drive results.
Use AI and automation to streamline marketing workflows, improve consistency, and move faster.

See how your site performs in search and AI visibility.
View Now →Strategic solutions aligned to your business goals and growth objectives.
Talk to a strategist to find the best path for your goals.
Book a Discovery Call →Actionable insights, guides, and tools to help you grow.

Learn how to increase your brand's visibility in AI search.
Download Kit →Learn about Silverback Marketing and what makes us different.
Let's start a conversation. We're here to help you grow.
Most reports bury the point under twenty slides. Executives read in a specific pattern, which means the template has to put the answer first and the proof second. This page gives you the exact structure, the metrics that belong up top, and worked examples you can copy. The template is free. The clarity is the whole point.
Organic is now our lowest cost acquisition channel. The quarter is ahead of plan.
There is a predictable pattern to how a senior leader reads anything that lands on their desk. They scan the top to decide if it is relevant. They look for the ask or the headline result. Then, only if they need to, they dig into the detail to check whether the conclusion holds up.
Most reports are built backwards from that. They open with methodology and context, march through every data point, and save the conclusion for a slide most people never reach. The information is all there. It is just in the wrong order for the person reading it.
A good executive reporting template fixes the order. It leads with the answer, supports it with a few drivers, and keeps the deep detail available but out of the way. Same data, sequenced for the reader instead of the author.
Every strong executive report shares the same skeleton. The content changes by team and goal, but the order rarely should. Here is the structure we use and recommend.
One screen. The single result that defines whether this period went well, the trend behind it, and one plain sentence summarizing the state of things. If a leader reads only this, they still know where they stand.
Executives read to make decisions, so tell them what you need early. The budget call, the priority, the green light. Put it near the top, not buried at the end.
The three to five things that moved the headline number. What changed, what you did, what it returned. This is the "why" behind the result.
The next layer of detail for anyone who wants to verify the story. Grouped, labeled, and never crowding out the headline.
A short, owned action list. Each item has an owner, a due date, and the expected benefit. This is what turns a report into momentum.
The raw data, the full breakdowns, the technical detail. Present for the people who dig, invisible to the people who do not.
Before anything else, decide the single number that answers "did this period go well." For a sales org it might be pipeline. For SEO it is usually revenue from organic. For a product team it could be activation. Everything else on the report supports this one number. If you cannot name it, you are not ready to build the template yet.
List every metric you currently track, then sort it into two piles: what the executive needs to make a decision, and what your team needs to do the work. The first pile goes on page one. The second pile moves to the appendix. The test for every metric is simple: can you tie it to a business outcome. If not, it does not earn a spot up top.
Wire up the tools that feed the report, for example Google Analytics 4, Search Console, your CRM, and your rank tracker. More important than the connection is the agreement: settle on how each metric is defined and how attribution works before the first report goes out. The fastest way to lose an executive's trust is a number that changes meaning between months.
Lay out the six sections from the anatomy above as a fixed template. Same order, same labels, same place every period. Consistency is a feature. When the layout never changes, a leader learns to read it in seconds instead of relearning it every month. Build it so the numbers refresh and the structure stays put.
A chart without a sentence is a riddle. For every key metric, write one line that explains what moved it. Was it a new content push, a seasonal spike, a site change, a pricing test. The insight is the part only a human can add, and it is the part executives remember. End every report with the priority actions so the reader always knows what happens next.
Structure is easier to trust when you can see it filled in. Below is a sample executive report built on the template above. Swap in your own numbers and you have a working draft.
Organic is now our lowest cost acquisition channel. The quarter is ahead of plan.
Approve a 15 percent budget increase for content next quarter to hold this trajectory through our seasonal peak.
Organic sessions, qualified leads, cost per acquisition versus paid, average position for priority terms, and share of search versus top three competitors. Each shown as a small trend, each with one line of context.
| Action | Owner | Due | Expected benefit |
|---|---|---|---|
| Publish 4 more comparison pages | Content lead | Aug 15 | Extend page one coverage |
| Fix remaining slow templates | Dev | Jul 30 | Protect conversion gains |
| Refresh 6 decaying posts | SEO | Aug 31 | Recover lost rankings |
Full keyword movement, backlink changes, page level traffic, and the raw data exports.
The skeleton stays the same. What moves to page one changes with the audience. A marketing team wants engagement and content performance. A sales leader wants pipeline and conversion. A CEO or board wants revenue, cost, and trajectory. A CFO wants cost per acquisition next to every other channel.
YoY growth and margin
Non-brand demand growth
SQLs and conversion rate
Organic vs paid channels
Build the template once, then keep two or three variants that simply promote different metrics to the headline. The work behind it is identical. The framing is what makes each reader feel like the report was written for them, because it was.
Leading with methodology.
Nobody approved a budget because the data collection was rigorous. Lead with the result, keep the method in the appendix.
Reporting numbers with no story.
A metric with no sentence next to it makes the reader do your job. Always explain the change.
Changing the layout every month.
Inconsistency forces a relearn every time. Lock the structure and let only the numbers move.
Vanity metrics up top.
Impressions and rankings feel productive but rarely drive decisions. Promote the metrics that tie to revenue and demote the rest.
No next steps.
A report that ends without an owned action list is a status update, not a decision tool. Always close with priorities.
Download the free executive reporting template and the worked example above, ready to adapt. Or send us your data sources and we will build the whole thing for you, tuned to your business and your board.
A website redevelopment does not have to cost you rankings. Benchmark, map every URL, preserve your signals, and launch a rebuild that holds its SEO.
Read now →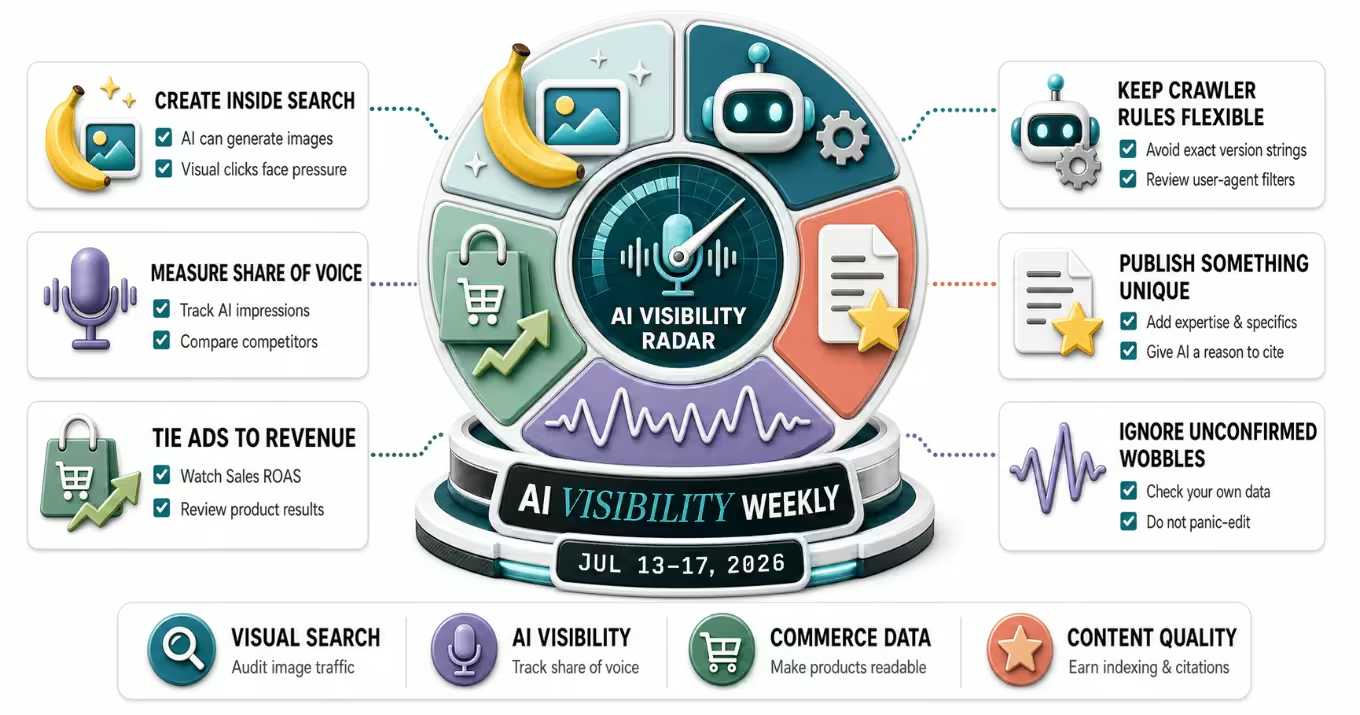
Google puts image generation in AI Overviews, Merchant Center begins grading AI visibility, and ChatGPT Ads adds revenue metrics. The July 13 to 17 recap.
Read now →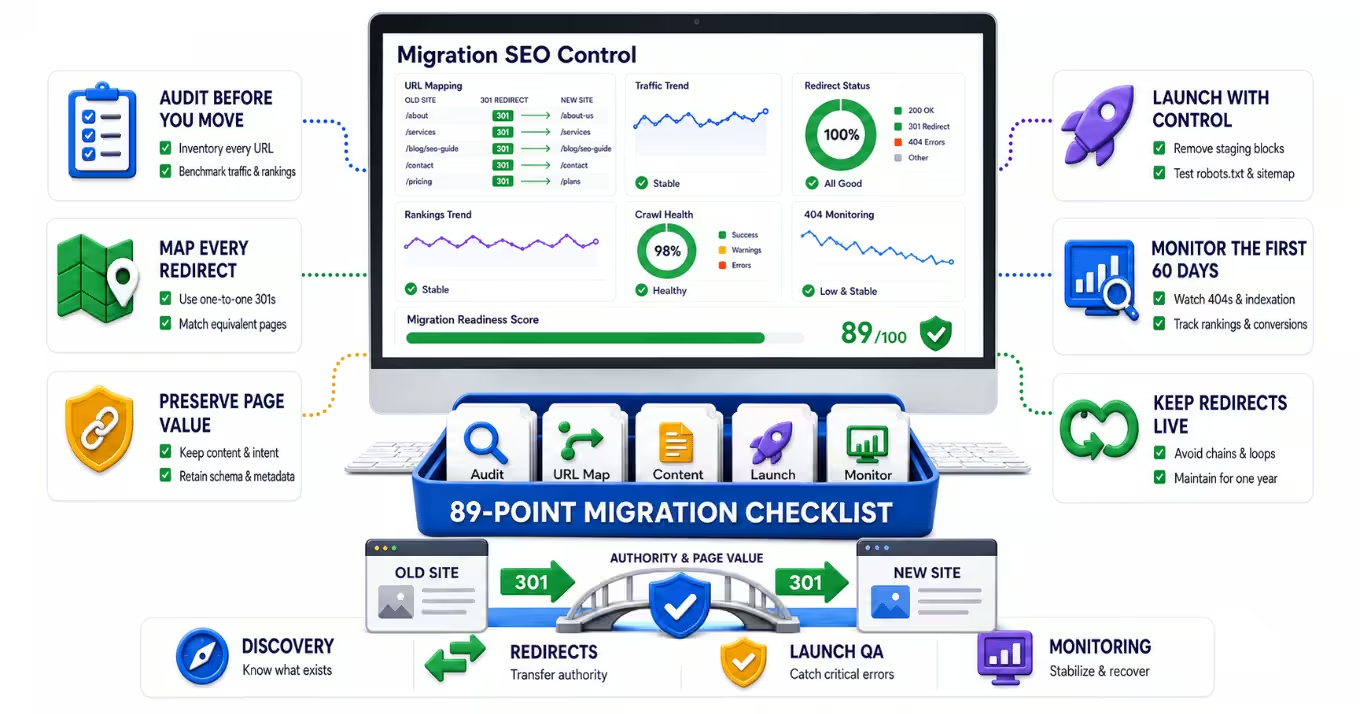
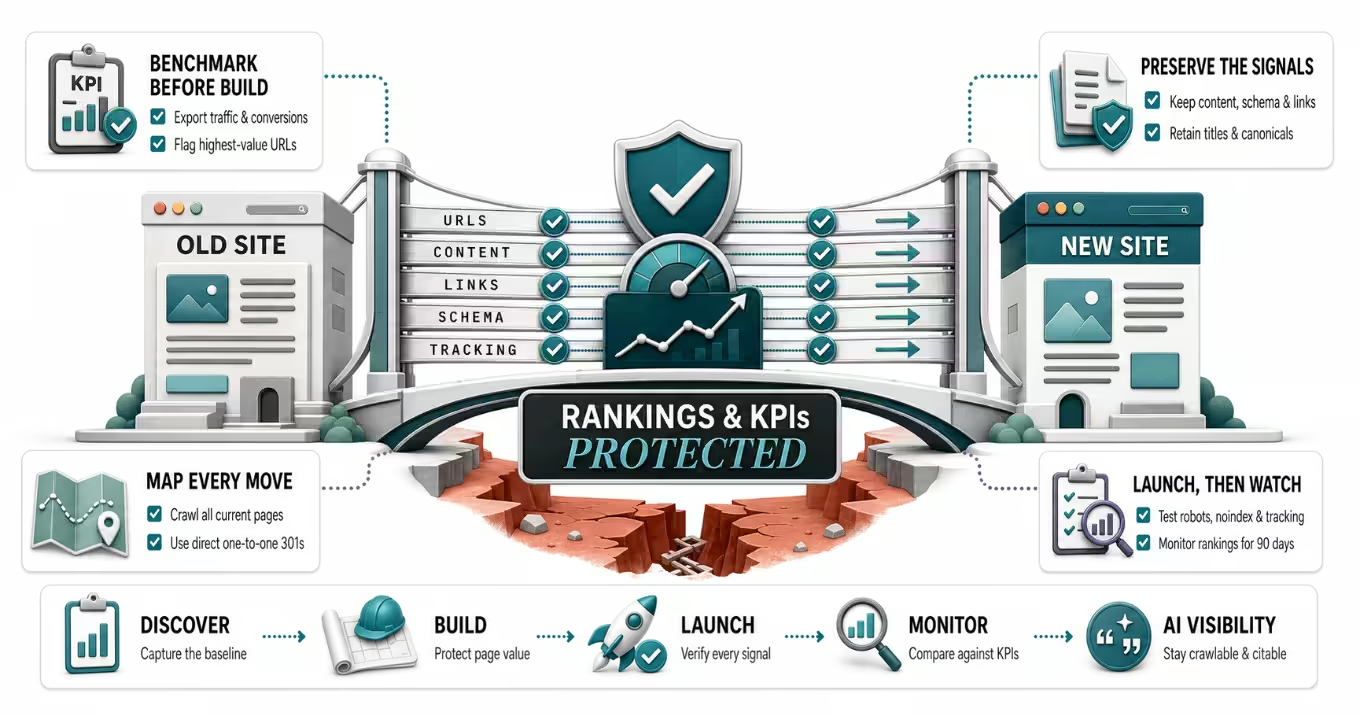
Rankings belong to URLs, not brands. Learn where migrations lose them and how a governed audit, redirect map, and checklist keep search visibility intact.
Read now →Build a smarter
growth strategy.
An audit takes 15 minutes of your time and gives you a prioritized 30‑60‑90 plan — whether or not we ever work together.