
Vanity metrics
Tell you something happened.
- Keyword rankingsUseful for the team doing the work
- Raw impressionsTells you something happened
- Traffic volume aloneVolume without conversion context
- Domain authority scoresThird-party proxies, not outcomes
Grow organic visibility across search engines and AI discovery platforms.
Drive qualified traffic, leads, and revenue with AI-driven paid media strategies.
Build high‑performing websites and conversion experiences that drive results.
Use AI and automation to streamline marketing workflows, improve consistency, and move faster.

See how your site performs in search and AI visibility.
View Now →Strategic solutions aligned to your business goals and growth objectives.

Talk to a strategist to find the best path for your goals.
Book a Discovery Call →Actionable insights, guides, and tools to help you grow.

Learn how to increase your brand's visibility in AI search.
Download Kit →Learn about Silverback Marketing and what makes us different.
Let's start a conversation. We're here to help you grow.
Your inbox does not need another 40 tab spreadsheet of keyword positions. Leaders want to know one thing: is this work making us money. We build reports that answer that question on the first slide, then back it up with everything underneath.
There is a familiar moment in a lot of leadership meetings. The SEO update comes up, a slide full of keyword rankings appears, and you can watch the room quietly check out. It is not that leaders do not care about SEO. It is that the report was written in a language they were never meant to read.
Rankings go up and down. Impressions wobble. None of it answers the question an executive actually has, which is simple: what did we get back for what we put in.
When reporting fails that test, three things happen. Budget gets questioned. Good work goes unnoticed. And the next quarter's investment gets harder to defend than it should be.
Good executive reporting does not add more numbers. It cuts the ones that do not earn their place and reframes the rest around outcomes. Here is the difference in plain terms.
Tell you something happened.
Tell you what it was worth.
We do not throw the team metrics away. We move them to where they belong, which is underneath the headline, available when someone wants to dig, never crowding out the answer.
Every report is anchored by the metrics below. The top of every report is reserved for the two or three that map most directly to how your business defines a good quarter. The rest support the story.
The headline number. How much actual revenue can be traced to organic traffic, modeled honestly with the attribution method we agree on up front.
For longer sales cycles, revenue lags. We report the pipeline organic is feeding right now: qualified leads, demo requests, and sales accepted opportunities.
What it costs to win a customer through SEO, set side by side with paid and other channels. Usually the moment a skeptical CFO leans in.
The percentage of total search demand in your category that you capture versus competitors. SEO reframed as market position you are gaining or losing.
Brand search mostly reflects demand you already earned elsewhere. Non-brand growth shows new people finding you who did not know your name yesterday.
Traffic that does not convert is a vanity number wearing a nice suit. We report what organic visitors actually do once they arrive.
Which content and which pages are pulling their weight, and which are not. This tells leadership exactly where the next dollar should go.
Where the numbers are heading over the next two to four quarters at the current investment level, with the assumptions stated plainly.
Organic pipeline up 14%. Non-brand demand growing for the first time in three quarters.
One screen. Revenue or pipeline from organic, the trend direction, and a single sentence in plain English that says how the quarter is going. Leadership reads page one. Everything else is available when they need it.
The few drivers behind the number. What moved, what the team did, and what it returned. Three bullet points maximum. If it takes more than three to explain the quarter, the report is doing the wrong job.
The deeper metrics, keyword and technical detail, and working data. There for anyone who wants it, never in the way of the people who do not. Appendix sections, not the report itself.
The format is consistent every single month, so leaders learn to read it in seconds instead of relearning a new layout every time.
You get a live dashboard you can open any day of the month, plus a short narrated summary at the close of each reporting cycle. The dashboard is for checking. The summary is for deciding. We connect the data sources, agree on the attribution model in advance so the numbers are never a surprise, and write the takeaways in language a non specialist can act on.
Open any day of the month. Same metrics, same layout, no relearning.
A short written readout at cycle close for leaders who need the story, not the spreadsheet.
Revenue and pipeline rules set up front so every number ties back to the business the same way every month.
No logins you forget. No charts without a sentence explaining them. No metric on the page that we cannot tie back to the business.
Pipeline contribution, cost per SQL, and organic revenue are the first numbers in the report. Sessions and clicks are in the appendix where they belong.
Page one fits a single screen. No scrolling required to get the answer. If leadership has to scroll to understand the quarter, the report is not doing its job.
If a metric does not connect to pipeline, revenue, or a decision that affects either, it is not in the main report. That is the filter applied to every data point in the template.
Send us your domain and we will build a one page sample executive report on your real numbers, so you can see the difference instead of taking our word for it.
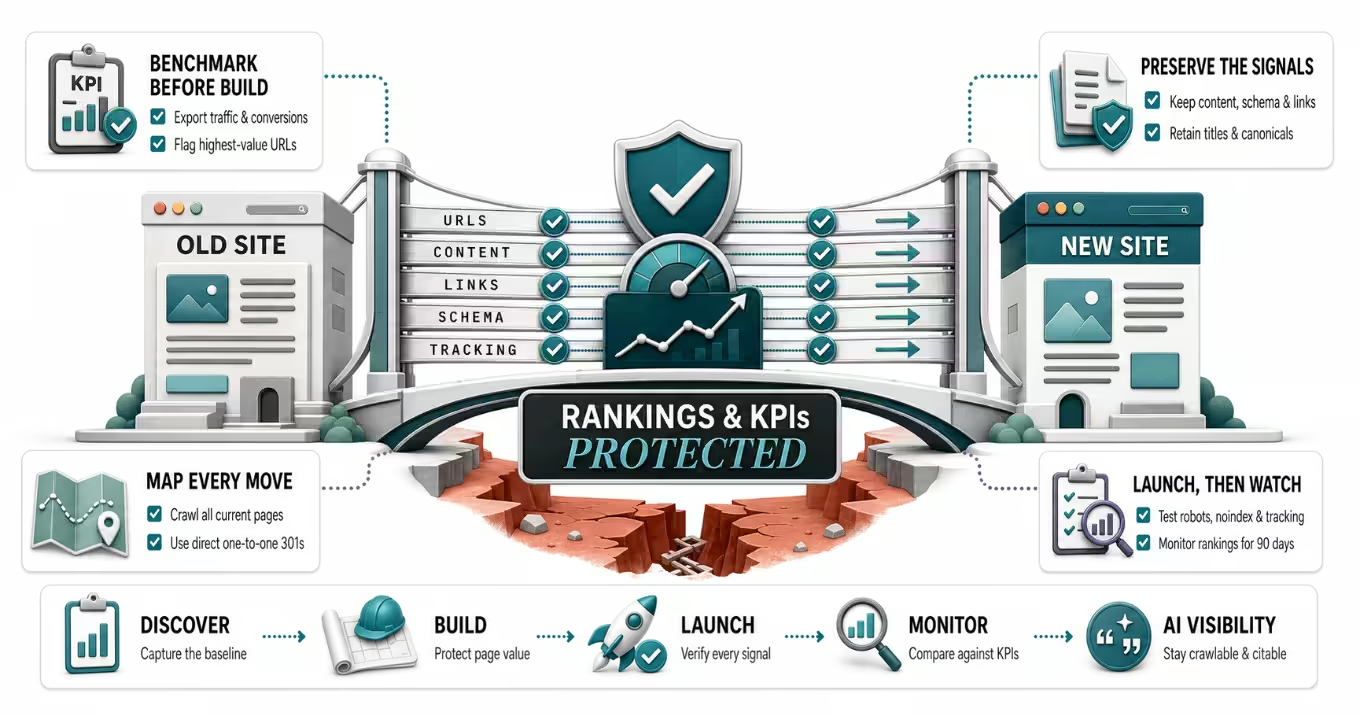
A website redevelopment does not have to cost you rankings. Benchmark, map every URL, preserve your signals, and launch a rebuild that holds its SEO.
Read now →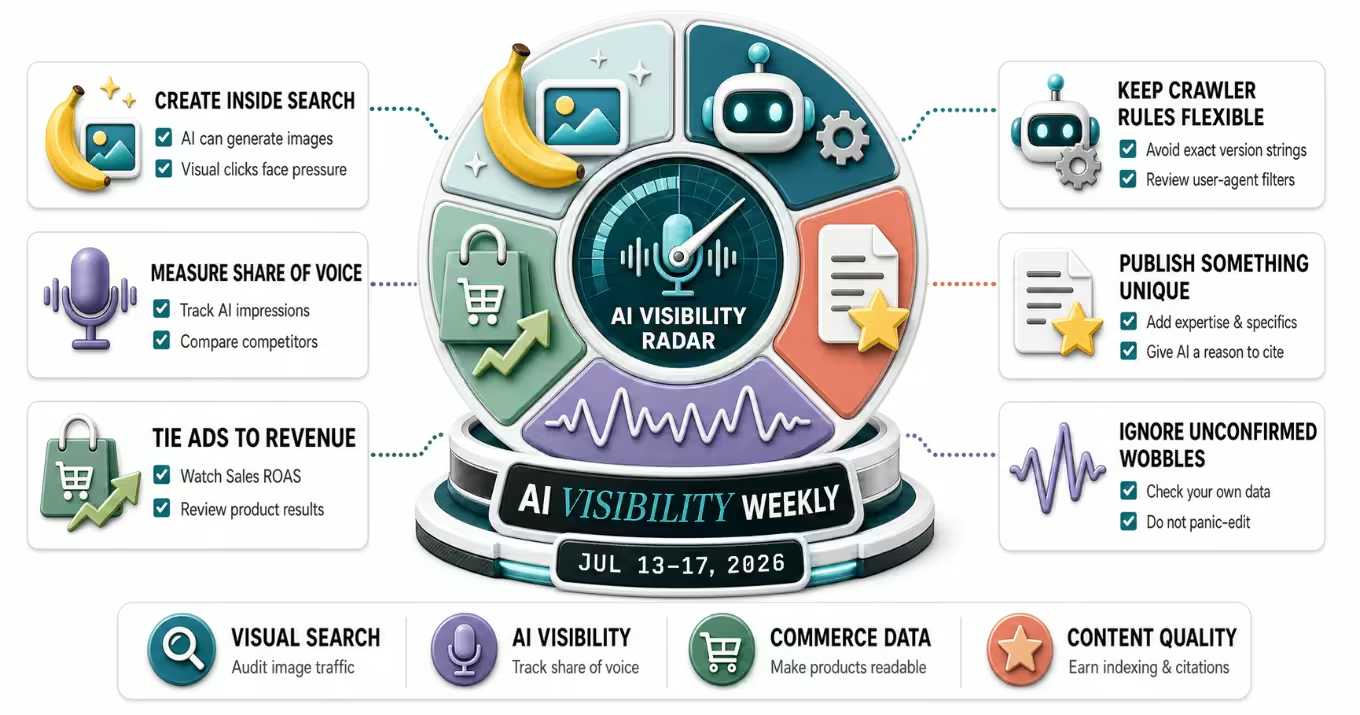
Google puts image generation in AI Overviews, Merchant Center begins grading AI visibility, and ChatGPT Ads adds revenue metrics. The July 13 to 17 recap.
Read now →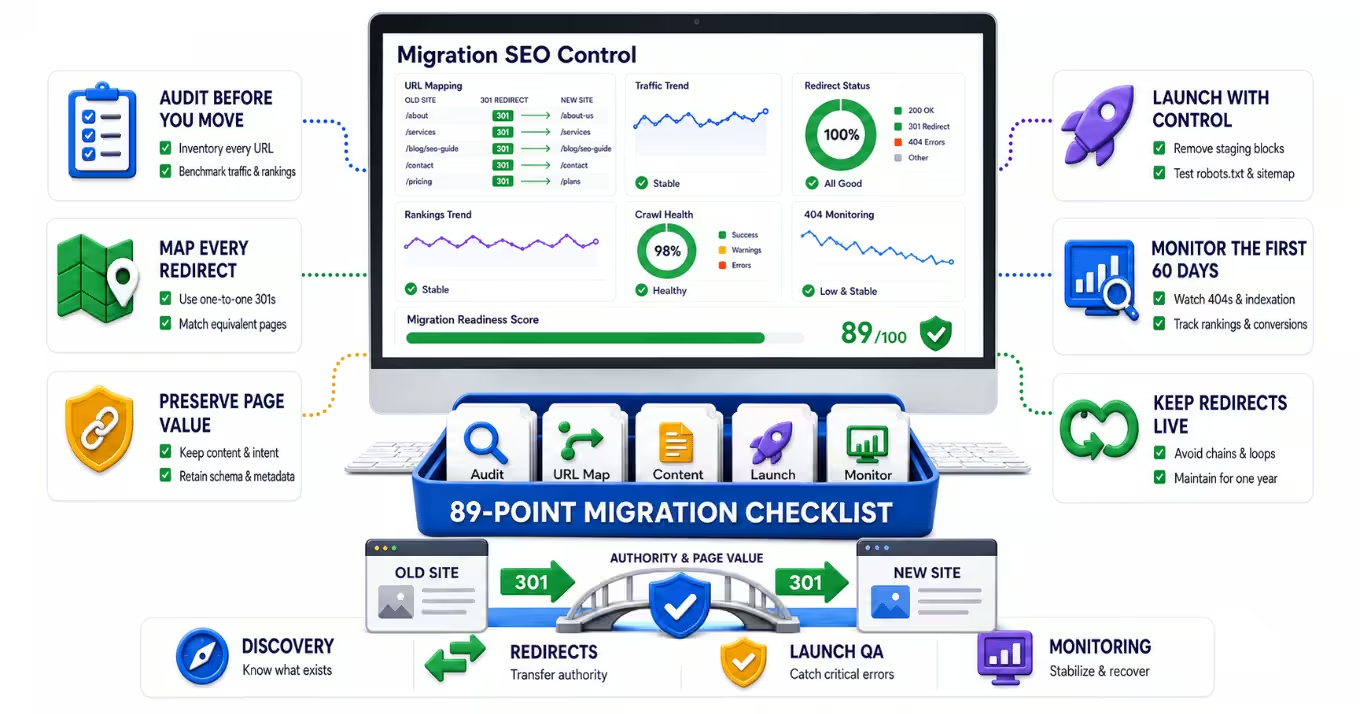
Rankings belong to URLs, not brands. Learn where migrations lose them and how a governed audit, redirect map, and checklist keep search visibility intact.
Read now →Build a smarter
growth strategy.
An audit takes 15 minutes of your time and gives you a prioritized 30‑60‑90 plan — whether or not we ever work together.