


SEO Reporting Metrics Executives Actually Care About
Every SEO team has experienced some version of the same meeting. You present a ranking report showing that fifteen keywords moved up in position, traffic is trending in the right direction, and you've published a solid volume of content this quarter. The executive in the room nods politely and asks: "But what did it do for revenue?" You don't have a clean answer, and the meeting ends with a vague commitment to connect the dots better next time.
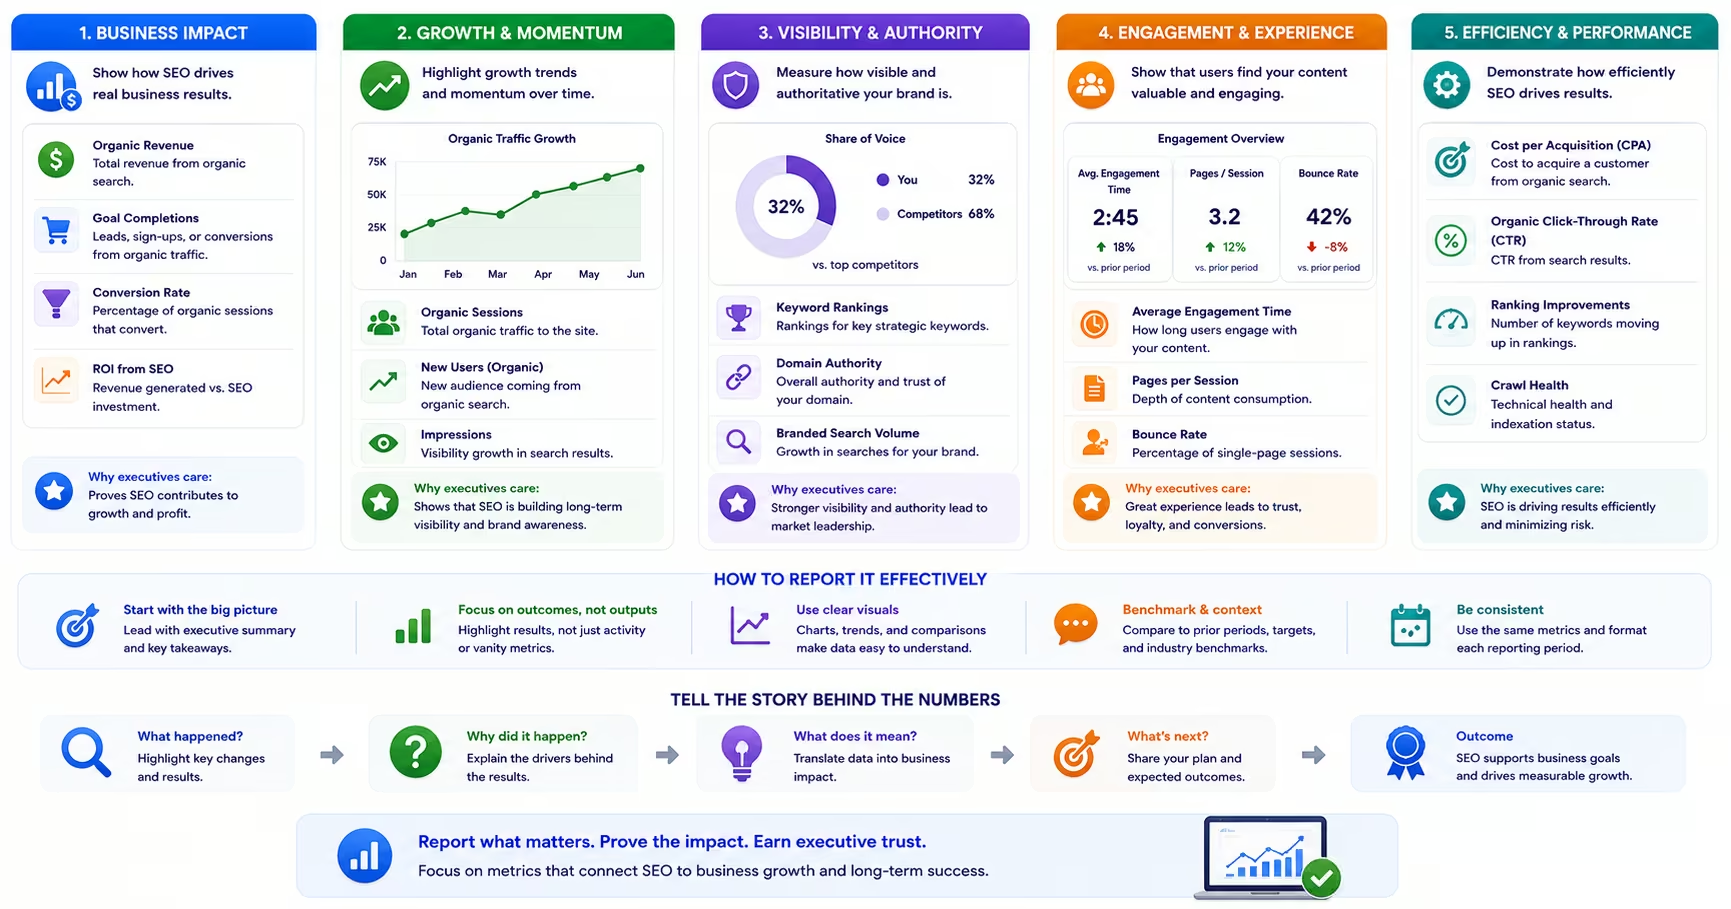
The problem is not that SEO doesn't drive revenue. It usually does, often substantially. The problem is that the metrics most SEO teams default to, keyword rankings, organic sessions, domain authority, do not speak the language that executives use to evaluate business performance. This article explains which metrics actually matter to decision-makers, how to frame SEO performance in terms that resonate in the boardroom, and what a genuinely useful executive SEO report looks like. Our SEO reporting for executives template is built for exactly that conversation.
The Vanity Metric Problem
Keyword rankings feel important because they are tangible and competitive. Watching your page climb from position eight to position three for a target keyword is gratifying, and it is a useful signal for SEO practitioners managing day-to-day optimization. But rankings do not tell an executive whether the SEO program is worth its cost. A brand can rank first for dozens of keywords that its target customers never search, and generate zero business value from those rankings.
Domain authority has the same problem. It is a useful proxy metric for comparing competitive authority in keyword research tools, but it is not a Google metric, does not correlate reliably with revenue, and fluctuates in ways that have nothing to do with the quality of your SEO program. Presenting domain authority in an executive report invites skepticism rather than confidence, because any exec who asks a follow-up question will quickly learn it is a third-party estimate, not a Google measurement.
The path to executive buy-in for SEO is abandoning these vanity metrics in reporting contexts and replacing them with outcome metrics that executives already understand: revenue, qualified leads, cost per acquisition, and market share. SEO and GEO reporting should tell that story—not just rank movement.
Revenue Contribution: The Metric That Earns Budget
For e-commerce businesses, organic revenue attribution is relatively straightforward: Google Analytics or your analytics platform can report revenue from organic search sessions by product category, landing page, and conversion type. The number to lead with in an executive report is organic revenue, ideally trended over the prior twelve months to show growth trajectory alongside any seasonality.
For B2B and lead generation businesses, the path from organic visit to closed revenue requires a full attribution model. This means tracking organic search leads through to CRM-qualified opportunities and closed deals, which requires integrating your web analytics with your CRM and, ideally, implementing offline conversion tracking to capture deals that close through phone or email after an initial organic search visit. The investment in that attribution infrastructure pays off significantly in reporting credibility because you can answer the revenue question directly rather than inferring it from traffic trends.
Qualified Lead Volume and Conversion Rates
For lead generation businesses, the highest-value SEO metric below revenue is qualified lead volume from organic search. Not all organic traffic is created equal. A spike in informational blog traffic may be positive for brand awareness and AI citation authority, but it is not the same as an increase in organic leads from pages targeting commercial and transactional queries. Presenting total organic traffic growth without segmenting by quality conflates these two very different outcomes.
Report qualified leads from organic search separately from total organic traffic, and include the organic lead-to-close rate if your CRM data supports it. A closing rate that is higher for organic leads than for paid leads, which is common, is a powerful argument for continued SEO investment. Executives understand conversion rates. A story that says "our organic leads close at 30% higher rate than paid leads, at a fraction of the cost per acquisition" is far more compelling than "we moved up twelve keyword positions."
Cost Per Acquisition from Organic vs. Paid
Comparing the cost per acquired customer from organic search to the equivalent cost from paid channels is one of the most persuasive executive-level arguments for SEO. Paid search cost per click has risen significantly over the past several years in most competitive niches. Organic search, once established, generates traffic at marginal cost. The blended cost per acquisition from organic is typically a fraction of the equivalent paid cost, and the differential widens as organic authority compounds over time.
Frame this comparison clearly in your reporting. Show what it would cost to acquire the same number of customers through paid search alone, and present the organic channel's contribution as a cost offset against that hypothetical spend. This translates SEO from a marketing investment into a cost efficiency story, which resonates strongly with financial decision-makers.
Core Web Vitals in Business Terms
Core Web Vitals reports should not appear in executive presentations as technical scores. They should appear as user experience and conversion rate implications. A page with poor LCP scores has a higher bounce rate. Higher bounce rates reduce conversion rates. Lower conversion rates increase cost per acquisition. Connecting that chain of causality in a brief, clear statement is how technical SEO performance gets translated into business language that executives can act on.
If you have data connecting Core Web Vitals improvements to conversion rate changes on specific pages, include those data points specifically. "Improving our homepage LCP from 4.2 to 1.9 seconds reduced bounce rate by 18% and increased contact form submissions by 12% in the following quarter" is an executive-ready statement that makes the case for continued technical investment without requiring the audience to understand what LCP means.
AI Overviews: The Emerging Metric
Forward-looking executives are increasingly aware of AI-powered search and are beginning to ask questions about their brand's visibility in AI-generated answers. Including a brief AI Overviews visibility update in your quarterly report, even if the measurement is still developing, signals that your team is managing search holistically rather than through the lens of metrics that are already a decade old.
Keep the AI section simple: track whether your key pages are being cited in AI Overviews for your target queries, report the trend directionally, and connect it to the broader organic performance story. This positions SEO as a forward-looking investment rather than a mature channel running on autopilot.
Frequently Asked Questions
Common questions about GEO, SEO, and AI-driven search visibility.
Long sales cycles require multi-touch attribution models that credit organic search for its role in the customer journey even when the final conversion comes through a different channel. Integrating your analytics platform with your CRM and tracking lead source through to close date is the most reliable approach. Marketing mix modeling can also help quantify organic's contribution in complex, multi-channel journeys.
A brief keyword performance summary can be useful as supporting context, particularly for competitive intelligence, but it should not be the headline metric. If you include rankings, connect them to the business outcome: "We moved from position 6 to position 2 for our primary product category term, which contributed to a 23% increase in organic trials this quarter."
For early-stage or newly launched sites, proxy metrics like organic traffic growth, indexed page count, organic lead volume, and branded search volume growth are appropriate interim metrics. Frame them explicitly as leading indicators of future revenue rather than outcomes, and set expectations about the timeline for organic search to become a significant revenue contributor.
Monthly dashboards with a brief narrative are appropriate for most marketing leadership teams. Quarterly business reviews should include a more detailed analysis of SEO's contribution to pipeline and revenue alongside forward-looking investment recommendations. Avoid weekly rankings reports at the executive level; ranking fluctuations on weekly time horizons create noise rather than signal.
One page for the executive summary with three to five business-outcome metrics and a brief narrative of the quarter's highlights. Supporting appendices can go deeper into the technical and tactical details for stakeholders who want them, but the executive summary should be readable in under two minutes.
Transparency with context is the right approach. Explain what drove the performance, whether algorithm update, competitive shift, or technical issue, what you have done or plan to do to address it, and what the expected recovery timeline is. Executives are far more concerned about a team that does not understand why performance declined than about the decline itself.
A brief competitive context snapshot is valuable in quarterly reports. Showing your organic traffic and ranking trends relative to two or three primary competitors reframes SEO as a competitive capability rather than an internal efficiency metric, which is a more compelling frame for executive audiences.
References
All statistics and data points cited in this article link to their original sources.