
$836B
Global digital ad spend
Digital now accounts for 73% of total media spend
+8.2% search growth
Source: eMarketer, 2026
Grow organic visibility across search engines and AI discovery platforms.
Drive qualified traffic, leads, and revenue with AI-driven paid media strategies.
Build high‑performing websites and conversion experiences that drive results.
Use AI and automation to streamline marketing workflows, improve consistency, and move faster.

See how your site performs in search and AI visibility.
View Now →Strategic solutions aligned to your business goals and growth objectives.

Talk to a strategist to find the best path for your goals.
Book a Discovery Call →Actionable insights, guides, and tools to help you grow.

Learn how to increase your brand's visibility in AI search.
Download Kit →Learn about Silverback Marketing and what makes us different.
Let's start a conversation. We're here to help you grow.
Cross-industry CPC, CTR, CPA, ROAS, and ACoS benchmarks for Google, Meta, Microsoft, LinkedIn, TikTok, and Amazon — built for practitioners who need to know how their accounts compare and where to invest next.
This report compiles current performance benchmarks across every major paid media platform into a single reference for practitioners who need to know how their accounts compare, where industry performance is heading, and which channel efficiencies to pursue next. Use the benchmarks as a diagnostic starting point, not a universal target. Individual account performance varies based on vertical, creative quality, audience precision, account structure, and bid strategy maturity. Always compare your metrics against your own historical performance and calculate targets from your actual margin data before applying any industry average.
Search, Shopping, PMAX, and industry CPC benchmarks.
Social efficiency, format benchmarks, and Bing opportunity.
B2B CPL, native forms, Spark Ads, and Shop performance.
Retail media ACoS, purchase intent, and margin-based targets.
Save the complete 2026 benchmark report for offline reference, team sharing, and QBR decks.
Download PDF reportFind out which layer of your account is costing you the most before you apply these benchmarks.
Start the PPC quizPaid media in 2026 looks fundamentally different from what it looked like three years ago. AI-powered bidding now controls the majority of spend across every major platform. Third-party cookie deprecation has accelerated the shift to first-party data strategies. Retail media has become the fastest-growing ad channel. And the global digital advertising market has crossed $836 billion, with digital now accounting for 73% of total worldwide media spending.
This report compiles current performance benchmarks across Google Ads, Meta, Microsoft, LinkedIn, TikTok, and Amazon into a single reference built for practitioners who need to know how their accounts compare, where the industry is moving, and which platform efficiencies to pursue next.
Key headline figures for 2026:
Global digital ad spend: $836 billion (73% of total media spend)
Programmatic accounts for 91.5% of all digital display spend
78% of all Google Ads spend is now driven by AI bidding strategies
Average Google Search CPC rose 12% year over year in Q1 2026, the steepest annual increase since 2021
Retail media is the fastest-growing digital ad channel at +14.1% year over year
Amazon is projected to surpass $70 billion in ad revenue in 2026, making it the third-largest digital ad platform globally
| Platform | Avg CPC | Avg CTR | Avg CVR |
|---|---|---|---|
| Google Search | $2.96–$4.22 | 3.52% | 4.40% — $53.52 |
| Google Shopping | $0.86 | 0.86% | 1.91% — $38.87 |
| Performance Max | Blended | Blended | Blended — $43.91 |
| Meta (Facebook/Instagram) | $0.70–$1.92 | 2.19% | 1.57% — $38.17 |
| Microsoft/Bing | $1.54 | 3.10% | 2.94% — $41.44 |
| LinkedIn Sponsored Content | $5.74 | 0.50% | 3.5%* — $60–$115 |
| TikTok In-Feed | $1.02 | 0.61% | 1.92% — $42.60 |
| Amazon Sponsored Products | $1.20–$2.50 | 0.38% | 9.55% — $28.00 |
*LinkedIn CVR shown for Lead Gen Forms (native). External landing page average is 3.5%.
Total global advertising spend surpassed $1 trillion for the first time in 2026, with digital channels accounting for approximately $836 billion. Search advertising continues to command the largest share of digital budgets at roughly 40%, followed by social media at 32%, display at 18%, and video at 10%. The mix is shifting toward retail media and connected TV faster than most forecasters predicted even two years ago.
| Channel | 2024 Share | 2026 Share | YoY Growth |
|---|---|---|---|
| Search | 41% | 40% | +8.2% — AI bidding expansion |
| Social Media | 31% | 32% | +14.6% — Reels, TikTok, Stories |
| Display / Programmatic | 19% | 18% | +10.4% — Audience precision improvements |
| Video / CTV | 9% | 10% | +13.8% — Streaming ad inventory growth |
| Retail Media | — | Fastest growing | +14.1% — Amazon, Walmart, Instacart |
| Platform | Est. Digital Ad Revenue Share | Primary Strength |
|---|---|---|
| ~39% | Search intent, Shopping, YouTube | |
| Meta | ~20% | Social targeting, Reels, Lead Gen |
| Amazon | ~13% | Purchase intent, retail first-party data |
| Microsoft | ~4% | B2B audience, Bing search |
| TikTok | ~4% | Gen Z reach, video engagement |
| Others | ~20% | Programmatic, CTV, niche channels |
Google, Meta, and Amazon collectively account for more than 70% of all digital ad spend.
Programmatic note91.5% of all digital display advertising is now bought programmatically. The global programmatic market reached $725 billion in 2026, up 18% year over year. Retail media is the fastest-growing sub-channel at $62 billion, with Amazon, Walmart, and Instacart representing 78% of that category.
Google Ads remains the largest paid search platform and the baseline against which all other channels are measured. Cross-industry average CPC on Search reached $2.96 in Q1 2026, up 12% year over year from $2.64 in Q1 2025. AI bidding strategies now drive 78% of all Google Ads spend, and Performance Max campaigns absorb 34% of total Google budgets.
| Metric | 2025 | 2026 | Change |
|---|---|---|---|
| Avg CPC | $2.64 | $2.96–$4.22 | +12% |
| Avg CTR | 3.17% | 3.52% | +11% |
| Avg CVR | 4.20% | 4.40% | +5% |
| Avg CPA | $47.86 | $53.52 | +12% |
| Industry | Avg CPC | CTR | CVR |
|---|---|---|---|
| Automotive (Repair/Service) | $2.42 | 3.81% | 14.67% · $28.50 · Highest CVR of any vertical |
| Restaurants & Food | $1.89 | 4.01% | 5.29% · $30.27 · Low CPA, local intent |
| Arts & Entertainment | $1.43 | 4.12% | 4.10% · $30.27 · Low CPC, low CPA |
| Home Services | $3.24 | 3.54% | 6.82% · $43.82 · Strong CVR |
| Education | $2.94 | 3.76% | 4.28% · $44.98 · Balanced performance |
| E-commerce (Retail) | $1.16 | 3.71% | 2.81% · $45.27 · Low CPC, high volume |
| Travel & Hospitality | $1.96 | 4.68% | 3.42% · $62.18 · Highest CTR of all verticals |
| Health & Medical | $3.64 | 3.61% | 4.82% · $59.68 · Above-average CVR |
| Finance & Insurance | $5.18 | 3.44% | 5.10% · $72.44 · High LTV offsets high CPA |
| Real Estate | $2.87 | 3.38% | 2.47% · $87.92 · Long sales cycle |
| Technology (B2B/SaaS) | $4.82 | 2.09% | 2.04% · $133.52 · Highest CPA, longest cycle |
| Legal Services | $6.75 | 3.22% | 6.98% · $131.63 · Highest CPC of all verticals |
Performance Max has become the dominant campaign type in Google Ads, absorbing 34% of total budgets. Its blended CPA of $43.91 positions it favorably against pure Search CPA averages, though much of the efficiency gain comes from Display and Shopping inventory that carries lower conversion intent. In B2B SaaS accounts specifically, Performance Max underperforms standard Search, delivering 436% ROAS vs 553% ROAS in the same accounts, because PMax inventory skews toward Display when conversion signals are thin.
| Metric | Performance Max | Search Only | Shopping Only |
|---|---|---|---|
| Avg CPA | $43.91 | $53.52 | $38.87 — PMax blended across inventory types |
| ROAS (E-commerce) | 3.5x–5.0x | 4.5x | 6.2x — PMax attribution requires scrutiny |
| ROAS (B2B SaaS) | 4.36x | 5.53x | N/A — PMax underperforms in B2B context |
| Budget share (2026) | 34% of budgets | Declining | Stable — Driven by Google defaults |
| Best suited for | E-commerce, lead gen | High-intent B2B | Retail product |
Quality Score impactA Quality Score of 10 saves 50% on CPC versus the baseline. Improving from QS 5 to QS 8 reduces cost per click by 37%. Keywords stuck at QS 1-3 can cost up to 400% more per click than the QS 5 baseline. Most accounts have 20-40% wasted spend that can be reallocated by fixing search term hygiene and improving landing page relevance.
Meta remains the dominant social advertising platform for both B2C and direct-to-consumer brands. Facebook and Instagram combined deliver a median CTR of 2.19% and an average CPA of $38.17 across all industries. CPM climbed to $13.48 in 2026, reflecting the increasingly competitive Meta auction as more advertisers shifted budgets toward Reels inventory and AI-optimized Advantage+ campaigns.
| Metric | Cross-Industry Average | |
|---|---|---|
| Avg CTR (all formats) | 2.19% | |
| Avg CPM | $13.48 | |
| Avg CPC (traffic campaigns) | $0.70 | |
| Avg CPC (lead gen campaigns) | $1.92 | |
| Avg CPA (all industries) | $38.17 | |
| Avg CVR | 1.57% | |
| Median ROAS | 1.93x |
| Industry | Avg CPC | CTR | CVR |
|---|---|---|---|
| Apparel & Fashion | $0.45 | 2.84% | 1.87% · $22.45 · Lowest CPC on platform |
| Food & Beverage | $0.52 | 2.47% | 1.54% · $32.07 · High volume, consistent |
| Art & Home Decor | $0.63 | 2.92% | 1.42% · $28.18 · Highest CTR on platform |
| Education | $0.98 | 2.11% | 4.82% · $7.85 · Lowest CPA on platform |
| Health & Wellness | $1.42 | 2.38% | 1.26% · $43.21 · CTR growing +22.8% YoY |
| Real Estate | $1.76 | 1.58% | 1.12% · $58.44 · Long consideration cycle |
| Finance & Insurance | $2.12 | 1.64% | 0.94% · $72.36 · High LTV offsets high CPA |
| Technology (B2B) | $2.18 | 1.48% | 0.68% · $74.12 · Low CVR, best for remarketing |
| Legal | $2.44 | 1.32% | 0.72% · $88.14 · Highest CPC on platform |
| Format | CTR Benchmark | Best Use Case | Notes |
|---|---|---|---|
| Feed Single Image | 1.5%–2.5% | Brand awareness, DTC | Workhorse format for most accounts |
| Reels Video | 2.0%–4.0% | UGC, product demos | Fastest-growing format in 2026 |
| Carousel | 1.8%–3.2% | E-commerce, multi-product | Higher engagement than single image |
| Collection / Instant Experience | 3.0%–5.0% | DTC shopping | Mobile-first, high purchase intent |
| Lead Gen (native form) | 2.5%–4.5% | B2B and services | 2x-3x CVR vs external landing page |
| Stories | 0.8%–1.4% | Retargeting, limited-time offers | Short-lived, impulse format |
Reels is the format to prioritizeBooks and Music saw a 25.45% YoY CTR increase. Media and Publishing grew 24.17%. Health and Wellness climbed 22.80%. Native lead gen forms consistently outperform external landing pages on Meta, producing approximately 2x to 3x higher conversion rates for most B2B offer types.
Microsoft Ads is one of the most consistently underutilized channels in most paid media programs. Average CPC is $1.54, roughly 33% lower than Google Search, and average CPA is $41.44, approximately 30% below what Google delivers for comparable queries. The audience skews older, more educated, and higher-income, making it disproportionately valuable for financial services, B2B, healthcare, and legal verticals.
| Metric | Microsoft Ads | vs. Google Ads |
|---|---|---|
| Avg CPC | $1.54 | -33% vs. Google |
| Avg CTR | 3.10% | Slightly below Google |
| Avg CVR | 2.94% | Slightly below Google |
| Avg CPA | $41.44 | -30% vs. Google |
| ROI per $1 spent | $2.53 | +26% vs. Google |
| Industry | Avg CPC | CTR | CVR |
|---|---|---|---|
| Automotive | $1.64 | 5.10% | 5.20% · $28.42 · -33% |
| Finance & Insurance | $3.12 | 3.51% | 4.18% · $52.76 · -27% |
| Apparel & Accessories | $0.98 | 3.33% | 2.64% · $37.12 · -18% |
| Retail | $1.22 | 3.06% | 3.21% · $38.16 · -15% |
| Technology | $2.84 | 2.41% | 2.08% · $88.74 · -34% |
| Legal | $4.18 | 2.86% | 4.92% · $84.96 · -35% |
| Health & Medical | $2.06 | 2.94% | 3.64% · $46.21 · -23% |
| Travel | $1.14 | 4.22% | 2.86% · $42.84 · -31% |
The Automotive opportunityThe Automotive industry posts the highest CTR on Microsoft at 5.1% and one of the highest conversion rates at 5.2%, a combination that makes it the highest-ROI Microsoft vertical. The most common reason advertisers underallocate to Microsoft is the assumed complexity of managing two platforms, which the Microsoft import tool from Google largely eliminates.
LinkedIn is the highest-cost and lowest-volume paid media channel most B2B advertisers use, and it is frequently mismanaged because practitioners apply social media creative and bidding logic to what is fundamentally a direct response channel for enterprise and mid-market buyers. Average Sponsored Content CPC reached $5.74 in 2026. The cost is justified when the offer is right, the audience is surgical, and the format is chosen based on where the buyer is in the consideration cycle.
| Metric | Value | |
|---|---|---|
| Avg Sponsored Content CPC | $5.74 | |
| CTR, Single Image | 0.50% | |
| CTR, Video | 0.44% | |
| CTR, Carousel | 0.55% | |
| CTR, Document Ads | 0.62% (highest) | |
| CTR, Thought Leader Ads | 0.70% (highest overall) | |
| Lead Gen Form CVR (native) | 10%–18% (median 13%) | |
| External Landing Page CVR | 2%–6% (median 3.5%) |
| Industry | Avg CPC | Avg CPL | CTR |
|---|---|---|---|
| Technology (SaaS) | $7.84 | $70 | 0.48% — Free trial, demo request |
| Financial Services | $6.84 | $100 | 0.51% — ROI calculator, whitepaper |
| Legal Services | $7.95 | $120+ | 0.46% — Case study, consultation |
| Healthcare | $6.24 | $80 | 0.45% — Webinar, research report |
| Professional Services | $5.62 | $60 | 0.54% — Guide, checklist, playbook |
| Manufacturing | $4.91 | $50 | 0.52% — Product spec, demo video |
| Education | $4.18 | $47 | 0.58% — Course preview, webinar |
| Nonprofit | $3.12 | $38 | 0.61% — Impact report, event invite |
| Format | CTR Benchmark | Conversion Rate | Best For |
|---|---|---|---|
| Single Image Ad | 0.50% | 2%–5% (landing page) | Brand, awareness, lead gen |
| Video Ad | 0.44% | 1%–3% (landing page) | Demo, product story, thought leadership |
| Carousel Ad | 0.55% | 2%–6% (landing page) | Multi-product, step-by-step content |
| Document Ad | 0.62% | 4%–9% (landing page) | Research reports, playbooks, guides |
| Lead Gen Form | 0.58% | 10%–18% (native) | Demo requests, event registration |
| Conversation Ad | 0.35% | 30%–60% (native) | Hyper-personalized outreach |
| Thought Leader Ad | 0.70% | 3%–8% (landing page) | Executive visibility, brand trust |
Key insightLead Gen Forms are the single highest-impact format change available to most LinkedIn advertisers. They achieve a median conversion rate of 13% compared to 3.5% for the same offers sent to external landing pages. For gated content, the CPL from native forms averages $45 vs. $90+ when the same creative drives to a landing page with a form.
| Offer Type | Avg CPL | |
|---|---|---|
| Gated content (report, guide) | $45 | |
| Webinar registration | $55 | |
| Demo request | $115 | |
| Contact sales / consultation | $150 |
TikTok has matured from an experimental awareness channel into a full-funnel performance platform. Average CPC on in-feed ads is $1.02, making it one of the most affordable cost-per-click channels for consumer brands. Average CPM sits at $9.16, significantly below Meta's Facebook CPM of $13.48, which means reach is cheaper for brands with the creative to take advantage of it. The caveat is that TikTok creative requirements are unforgiving: content that does not look native to the platform performs dramatically below these benchmarks.
| Metric | Value | |
|---|---|---|
| Avg In-Feed CPC | $1.02 | |
| Avg CPM (In-Feed) | $9.16 | |
| Avg CTR (In-Feed) | 0.61% | |
| Avg CVR (In-Feed) | 1.92% | |
| TikTok Shop product ad CVR | 3.70% | |
| Spark Ads CTR vs In-Feed | +2.4x | |
| Spark Ads CVR vs In-Feed | +44% |
| Industry / Format | Avg CPC | CTR | CVR |
|---|---|---|---|
| Retail / E-commerce | $0.79 | 0.82% | 2.14% · $8.44 · Strongest overall performer |
| Beauty & Personal Care | $0.74 | 0.94% | 2.38% · $7.92 · High UGC content ROI |
| Food & Beverage | $0.82 | 0.88% | 1.96% · $8.76 · Strong viral potential |
| Fashion & Apparel | $0.86 | 0.91% | 1.82% · $9.14 · Reels-style creative essential |
| Technology / Apps | $1.24 | 0.54% | 1.44% · $11.28 · Lower CTR vs consumer verticals |
| Finance | $1.71 | 0.42% | 1.12% · $13.88 · Highest CPC vertical |
| Spark Ads (any vertical) | +29% CPM | 2.4x CTR | +44% CVR · Premium · Native creator content boost |
| TikTok Shop Ads | $0.68 | 1.24% | 3.70% · $7.14 · Highest CVR format |
| In-Feed Standard | $1.02 | 0.61% | 1.92% · $9.16 · Baseline benchmark |
Key insightSpark Ads are the highest-leverage format change available to TikTok advertisers. They boost organic creator content that already has engagement, resulting in 2.4x higher CTR and 44% higher conversion rates vs standard in-feed creative, despite a CPM premium of 29%. For brands without a strong creator partnership program, TikTok Shop product ads offer a path to 3.7% CVR with significantly lower creative production costs.
Amazon Advertising is projected to surpass $70 billion in revenue in 2026, cementing its position as the third-largest digital ad platform. What distinguishes Amazon from every other platform in this report is purchase intent: people searching on Amazon have already decided they want to buy something. This is why average conversion rates for Sponsored Products (9.55%) are dramatically higher than comparable search intent on Google (4.40%). The trade-off is that Amazon ACoS averages 22-35% across most categories, meaning ad costs are a substantial portion of revenue and margin management is critical.
| Metric | Value | |
|---|---|---|
| Avg ROAS (Sponsored Products) | 3.5x | |
| Avg CVR (Sponsored Products) | 9.55% | |
| Avg ACoS (all categories) | 22%–35% | |
| Avg CPC (Sponsored Products) | $1.20–$2.50 | |
| Retail media YoY growth | +18% |
| Ad Type | Avg CTR | Avg CPC | Avg CVR |
|---|---|---|---|
| Sponsored Products | 0.38% | $1.20–$2.50 | 9.55% · 22%–35% · Core ASIN sales |
| Sponsored Brands | 0.20%–0.30% | $1.50–$3.00 | 5%–8% · 25%–40% · Brand awareness + discovery |
| Sponsored Display | 0.08%–0.12% | $0.60–$1.20 | 2%–4% · 35%–55% · Retargeting |
| Amazon DSP (programmatic) | n/a | $6–$12 CPM | 1%–3% · Variable · Reach beyond Amazon |
| Video Ads | 0.35%–0.55% | $0.40–$0.80 CPV | 3%–6% · Variable · Brand storytelling |
| Category | Avg ACoS | Avg CPC | Competition Level |
|---|---|---|---|
| Electronics | 22% | $1.72 | Very High — Review volume is critical driver |
| Beauty & Personal Care | 24% | $1.24 | High — UGC content boosts CVR |
| Home & Kitchen | 26% | $1.08 | Medium-High — Strong seasonal fluctuation |
| Sports & Outdoors | 28% | $0.96 | Medium — Q4 spikes require planning |
| Clothing, Shoes, Jewelry | 30% | $0.82 | Medium — Size/variant complexity |
| Books & Media | 32% | $0.48 | Medium — Low CPC, margin challenge |
| Grocery & Gourmet Food | 24% | $0.72 | Low-Medium — Subscribe & Save impact |
| Toys & Games | 28% | $1.14 | High — Extreme Q4 seasonality |
Key insightBreak-even ACoS = your gross margin percentage. A product with 35% margins means any ACoS below 35% is profitable from advertising. The average Amazon account runs at 32% ACoS, which means accounts with margins above 35% are generating profit from advertising, while those with margins below 35% are paying to acquire customers at a net loss. Know your break-even number before setting any campaign target.
Return on ad spend is the most commonly cited performance metric in paid media and also the most commonly misinterpreted. A ROAS of 3.0x sounds good in isolation. Whether it is actually profitable depends entirely on your gross margin. For a brand with 25% margins, a 3.0x ROAS means spending $1 to make $3, with $0.75 in cost of goods, leaving $0.25 after ad spend and before any other operating expense. Always compare your ROAS against your break-even ROAS, not an industry average.
Break-even ROAS formulaBreak-even ROAS = 1 / gross margin percentage. A 30% margin business needs a minimum 3.33x ROAS to break even on advertising costs.
| Platform / Campaign Type | Avg ROAS | Median ROAS | Notes |
|---|---|---|---|
| Google Search | 4.5x | 3.2x | Highest intent traffic |
| Google Shopping | 6.2x | 4.8x | Product feed quality is critical |
| Performance Max | 3.5x–5.0x | 3.8x | Attribution requires scrutiny |
| Meta Facebook/Instagram | 2.9x | 1.93x | 7-day click, 1-day view window |
| Microsoft Bing Search | 3.1x | 2.4x | Lower CPC improves effective ROAS |
| TikTok In-Feed | 2.4x | 1.8x | Highly creative-quality dependent |
| Amazon Sponsored Products | 3.5x | 3.0x | Purchase-intent channel |
| Amazon Shopping | 5.8x | 4.2x | Competitive categories lower ROAS |
| LinkedIn B2B | 3.0x–7.0x | Varies | Long attribution cycle |
| Industry | Target ROAS (Google) | Target ROAS (Meta) | Notes |
|---|---|---|---|
| Apparel & Fashion | 4.0x–6.0x | 3.5x–5.0x | High return rate risk |
| Beauty & Personal Care | 4.5x–7.0x | 3.8x–5.5x | Repeat purchase model |
| Home & Garden | 3.5x–5.5x | 3.0x–4.5x | Seasonal peaks |
| Electronics | 5.0x–8.0x | 4.0x–6.0x | High AOV, lower margin % |
| Sporting Goods | 4.0x–6.5x | 3.5x–5.0x | Q4 critical |
| Health & Wellness | 3.5x–5.5x | 3.0x–4.5x | Subscription model opportunity |
| Food & Beverage (DTC) | 2.5x–4.0x | 2.0x–3.5x | Low margin category |
| Luxury / High AOV | 2.0x–3.5x | 1.8x–3.0x | LTV justifies lower immediate ROAS |
| SaaS / Technology | 2.0x–4.0x (LTV-based) | Pipeline ROAS | MRR-based accounting |
Quality Score is one of the most impactful and least-actively-managed variables in Google Ads. It determines how much you pay per click relative to competitors who hold the same position, and how often your ads are eligible to show at all. A QS of 10 saves 50% on CPC versus the baseline QS 5. A QS of 1-3 costs up to 400% more than the baseline. Most accounts contain a mix of high and low Quality Score keywords, meaning money is being wasted in specific corners of the account while other parts perform well.
| Quality Score | CPC Adjustment | Bid Required for Same Position | Recommended Action |
|---|---|---|---|
| 10 | -50% | Half of QS 5 advertiser | Maintain; monitor components |
| 9 | -44% | Significantly below average | Maintain; consider expansion |
| 8 | -33% | Below average | Good; refine landing pages |
| 7 | -22% | Slightly below average | Optimize ad copy and landing page |
| 6 | -11% | Near average | Review all three components |
| 5 | 0% | Baseline (average) | Action required |
| 4 | +11% | Above average | Audit search terms and landing page |
| 3 | +22% | Significantly above average | Restructure; create new ad groups |
| 2 | +33% | Well above average | Consider pausing; redesign |
| 1 | +400%+ | Maximum premium | Pause; fix root causes first |
Expected CTR is primarily a function of historical keyword CTR and ad copy relevance to the search term. To improve it: tighten ad group themes, write headlines that directly mirror the keyword intent, and mine search term reports for the language buyers actually use.
Ad Relevance is the match between keyword, ad headline, and user intent. To improve it: break large ad groups into tighter single-theme groups, use Dynamic Keyword Insertion deliberately, and make sure every headline could have been written specifically for the search term triggering it.
Landing Page Experience covers page load speed, mobile usability, content relevance, and the friction between the ad promise and the conversion action. Most accounts have the biggest QS gap here because it is the hardest to fix and requires cross-team coordination with web development.
| Issue | Estimated Budget Waste | |
|---|---|---|
| Irrelevant search terms (broad match without negatives) | 15%–30% | |
| Keywords with QS 1-4 inflating effective CPCs | 10%–20% | |
| Duplicate conversions / tracking errors | 5%–15% | |
| Budget allocated to underperforming campaigns instead of winners | 10%–25% | |
| Mobile traffic converting at less than 30% of desktop rate | Variable | |
| Total estimated wasted spend in average audited account | 20%–40% |
The shift toward AI-powered paid media is no longer a trend. It is the default state of the industry. Smart Bidding and Performance Max campaigns account for 78% of all Google Ads spend. Meta Advantage+ campaigns have overtaken manual targeting in adoption across large-budget accounts. LinkedIn is expanding Accelerate campaign types. TikTok Smart Performance Campaigns are the default for new advertisers. The question is no longer whether to use AI-powered tools. It is how to feed them quality inputs and maintain the strategic control that maximizes their output.
| Platform | AI Campaign Type | Adoption Rate | Avg Impact vs Manual |
|---|---|---|---|
| Performance Max | 34% of budgets | -18% CPA avg — 50+ conversions/month | |
| Smart Bidding | 78% of spend | -22% CPA avg — 30+ conversions/month | |
| AI Max for Search | Expanding | +13% revenue, +16% CPA — Robust negative keyword lists | |
| Meta | Advantage+ Shopping | Dominant in DTC | +15%–30% ROAS — Strong product catalog |
| Meta | Advantage+ Audience | Growing rapidly | +10% CVR avg — First-party data quality |
| TikTok | Smart Performance | Default for new | Varies by creative — UGC creative library |
| Accelerate | Early adoption | +25% CVR (LinkedIn data) — ICP definition required | |
| Amazon | Dynamic Bidding | Standard default | +12% ROAS avg — Conversion history |
Every AI bidding and automation system performs better when it has three things:
Sufficient conversion volume. Thirty conversions per month per campaign is the minimum threshold on Google. Fifty is where the system starts to thrive. Campaigns running Smart Bidding below these thresholds produce erratic spend behavior and learning periods that never stabilize.
Accurate conversion data. Imprecise conversion actions that count form fills on a low-quality traffic page as equivalent to a demo request teach the system to optimize for the wrong signal. The quality of the conversion data determines the quality of the optimization output.
High-quality creative variation. Every AI system needs material to test. RSAs with fewer than 8 headlines, Meta campaigns with one creative variant, and TikTok campaigns with only produced video give the algorithm nothing to optimize. Creative volume and quality set the ceiling on AI performance.
Before any optimization, validate that every conversion action records a genuine business outcome exactly once. Compare Google Ads reported conversions against CRM intake for the same period. A discrepancy above 15% is a signal of a tracking problem. Platforms cannot optimize toward outcomes they cannot see.
Brand keywords convert at 5-10x the rate of non-brand. Commingling them produces a blended metric that looks great and hides the fact that non-brand traffic is frequently unprofitable. Every platform covered in this report benefits from this structural separation.
Microsoft search delivers an average CPC 33% below Google and a CPA 30% lower for comparable queries. The import tool removes most of the setup friction. For accounts over $10K/month in Google Search spend, Microsoft typically delivers 15-25% incremental leads at a lower cost per lead.
Accounts with QS 1-3 keywords are paying up to 400% more per click than necessary. Before increasing bids to compete for volume, audit the three components and fix the lowest-scoring keywords. The cost reduction from QS improvement funds additional volume without increasing total spend.
Third-party cookie deprecation is accelerating. Customer Match lists, offline conversion imports, and CRM-synced audiences are the foundation of targeting quality in 2026. Accounts with strong first-party data consistently outperform those relying on platform-modeled audiences by 20-40% on CPA.
Native LinkedIn forms convert at a median of 13% versus 3.5% for the same offer sent to an external landing page. For any LinkedIn campaign with a gated content or demo request offer, the form-to-landing-page CVR differential alone typically reduces CPL by 40-60%.
TikTok content that looks like a produced ad underperforms Spark Ads or UGC by more than 2x on CTR. LinkedIn Document Ads outperform single-image ads by 24% on CTR because they match how LinkedIn users consume professional content. Repurposing creative across platforms without adapting it to platform context is one of the most common and most avoidable efficiency losses.
Platform-reported ROAS averages are irrelevant to your business without knowing your gross margin. Break-even ROAS equals 1 divided by gross margin percentage. A 30% margin business needs a minimum 3.3x ROAS to cover ad costs before any other operating expense. Set targets from your financials, not from platform benchmarks.
Compare your account against these benchmarks with a practitioner-led review from Silverback.
Request an auditBuild a program that turns benchmark insight into pipeline, not just dashboard activity.
Explore paid media| Metric | Low | Average | Strong |
|---|---|---|---|
| Search CPC | $1.16 | $2.96–$4.22 | Under $2.00 |
| Search CTR | Below 2% | 3.52% | Above 5% |
| Search CVR | Below 2% | 4.40% | Above 8% |
| CPA | High vs revenue | $53.52 | 30%+ below revenue |
| Quality Score | 1–4 | 5–6 | 7–10 |
| Metric | Low | Average | Strong |
|---|---|---|---|
| CTR | Below 1% | 2.19% | Above 3% |
| CPM | Above $18 | $13.48 | Below $10 |
| CPC | Above $2.50 | $0.70–$1.92 | Below $0.75 |
| ROAS | Below 2x | 1.93x | Above 4x |
| Metric | Low | Average | Strong |
|---|---|---|---|
| CTR | Below 0.3% | 0.50% | Above 0.8% |
| CPL (gated content) | Above $100 | $45–$60 | Below $35 |
| Lead Gen Form CVR | Below 8% | 13% | Above 18% |
| Metric | Low | Average | Strong |
|---|---|---|---|
| CTR | Below 0.4% | 0.61% | Above 1.0% |
| CPM | Above $14 | $9.16 | Below $7 |
| CVR (in-feed) | Below 1% | 1.92% | Above 3% |
| Metric | Low | Average | Strong |
|---|---|---|---|
| SP CTR | Below 0.2% | 0.38% | Above 0.6% |
| SP CVR | Below 5% | 9.55% | Above 15% |
| ACoS | Above margin | 22%–35% | Below break-even |
| ROAS | Below 2.5x | 3.5x | Above 5x |
This report draws on publicly available benchmark studies, platform-published data, and industry analyses updated through Q1 2026. Primary sources include WordStream, DataReportal, eMarketer, Statista, Triple Whale, Semrush, and platform-specific benchmark reports from Google, Meta, LinkedIn, TikTok, and Amazon. Benchmarks represent cross-industry averages across large sample sets. Individual account performance will vary based on vertical, budget level, creative quality, account structure, audience precision, and competitive landscape.
When applying any benchmark to your account, prioritize comparison against your own historical performance trends over external industry averages. The most actionable benchmark is the difference between where your account is today and where it was 90 days ago, with a clear hypothesis for why the gap exists and what will close it.
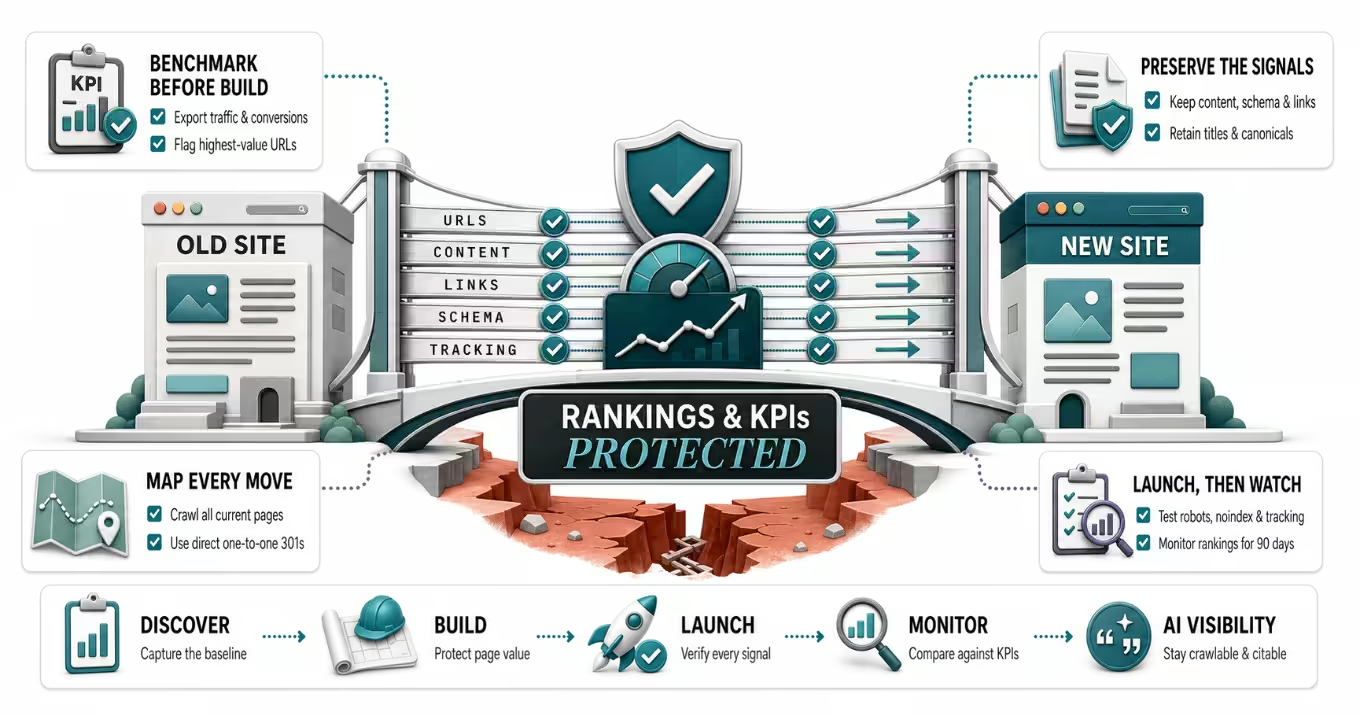
A website redevelopment does not have to cost you rankings. Benchmark, map every URL, preserve your signals, and launch a rebuild that holds its SEO.
Read now →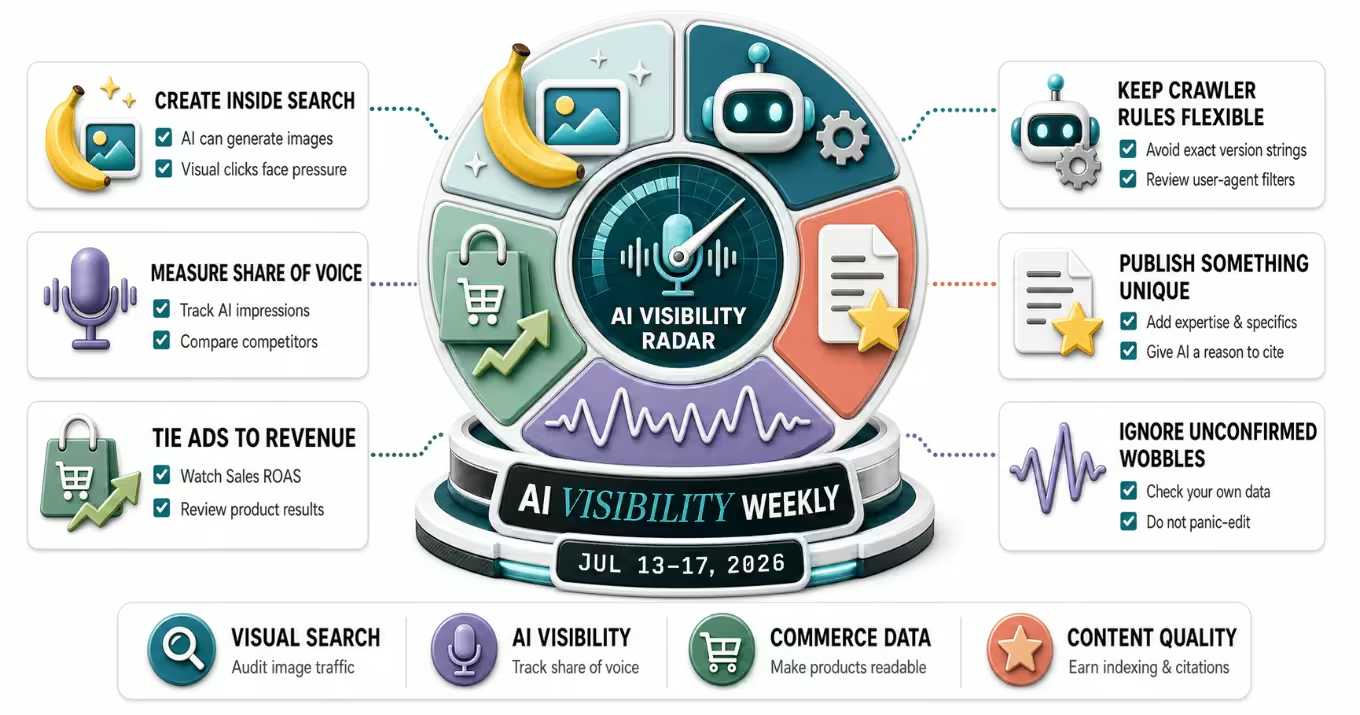
Google puts image generation in AI Overviews, Merchant Center begins grading AI visibility, and ChatGPT Ads adds revenue metrics. The July 13 to 17 recap.
Read now →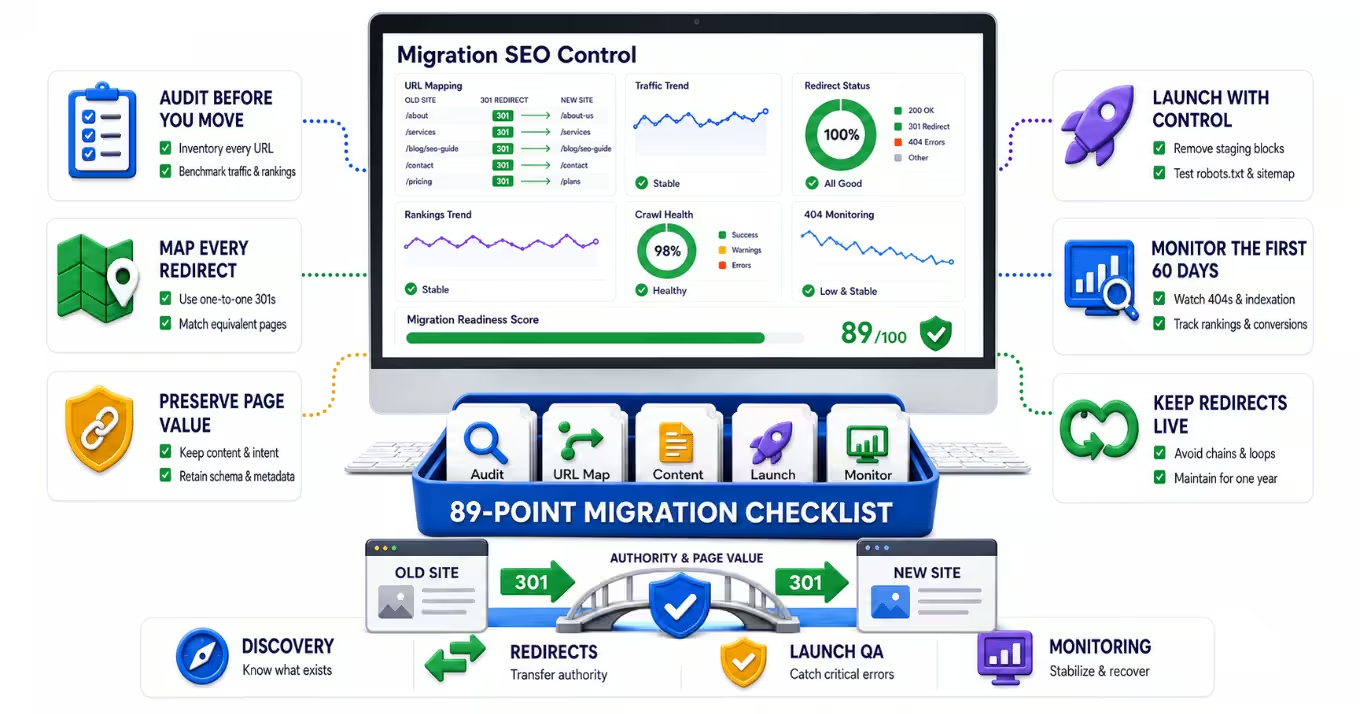
Rankings belong to URLs, not brands. Learn where migrations lose them and how a governed audit, redirect map, and checklist keep search visibility intact.
Read now →Build a smarter
growth strategy.
An audit takes 15 minutes of your time and gives you a prioritized 30‑60‑90 plan — whether or not we ever work together.